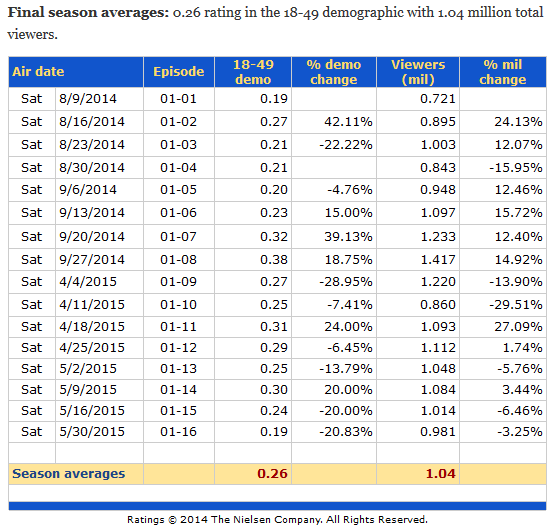
There is now a handy table from The Nielsen Company that lays out the viewer ratings for each episode of Outlander. I believe this is only day of, live viewings of the episodes. This does not take into account viewing the episode on demand or on a DVR. You can see the changes in viewers from episode, including the increase or decrease. The show lost viewers between Episode 108 and 109; that is when the long mid-season break occurred. The show also lost viewers for Episode 115 and 116. The show averaged 1.04 million viewers an episode.
Here are some other ratings posts from us and TV by the Numbers, which will give you some better insight into overall ratings:
-
‘Outlander’ Premiere Breaks Starz’s Multi-Platform Viewing Record
- ‘Game of Thrones’ Leads Top 20 Xfinity On Demand TV Shows for the Week Ending May 24, 2015
- ‘Game of Thrones’ Leads Adults 18-49 & Viewership Gains, ‘Orphan Black’ Tops Percentage Increases in Live +7 Cable Ratings for Week Ending May 17
- ‘Game of Thrones’ Leads Adults 18-49 & Viewership Gains, ‘Salem’, ‘Hot In Cleveland’, ‘Lost Girl’, ‘The Soup’ & ‘Bitten’ Top Percentage Increases in Live +7 Cable Ratings for Week Ending May 10
- ‘Game of Thrones’ Leads Top 20 Xfinity On Demand TV Shows for the Week Ending May 17, 2015
- ‘Game of Thrones’ Leads Adults 18-49 & Viewership Gains, ‘Orphan Black’ Tops Percentage Increases in Live +7 Cable Ratings for Week Ending April 26
- ‘Game of Thrones’ Leads Adults 18-49 Gains, ‘Younger’ Tops Percentage Increases & ‘The Americans’ Tops Viewership Growth in Live +7 Cable Ratings for Week Ending April 19
- ‘Better Call Saul’ Leads Adults 18-49 & Viewership Gains, ‘Salem’ Tops Percentage Increases in Live +7 Cable Ratings for Week 29 Ending April 12
Source: TV Series Finale, TV by the Numbers

